ESG & Climate Tech
TCFD is Not a Report, It's a Data Challenge. Here's How We Solve It.
Your board is asking the tough questions: "How will a global carbon tax affect our operating costs? What is the financial risk to our coastal facilities from sea-level rise?" These are the questions at the heart of the Task Force on Climate-related Financial Disclosures (TCFD). And they cannot be answered with a narrative report alone.
At its core, TCFD is a quantitative data challenge. It requires you to connect abstract climate scenarios to concrete financial metrics. As technical consultants, we act as the bridge between your strategy team and your data team, building the models that translate climate risk into a language the CFO and investors understand: dollars and cents.
Our Technical Workflow: From Scenario to P&L
Answering the boardroom's questions requires a structured, data-driven workflow. We don't just talk about risk; we build the tools to measure and monitor it.
Step 1: Identify Financial Levers
First, we work with your finance and operations teams to identify which specific line items on your P&L and balance sheet are most vulnerable to climate change. This could be anything from increased energy costs due to a carbon tax (a transition risk) to potential asset impairment from extreme weather (a physical risk). We map these financial levers to your core business operations.
Step 2: Model the Data
This is where the heavy lifting happens. We build a data model that integrates external climate data with your internal financial and operational data. This involves:
- Sourcing Climate Scenarios: We utilize recognized public scenarios (e.g., from the IEA or NGFS) that project variables like carbon prices, temperature increases, and rainfall patterns.
- Creating Impact Formulas: We develop specific formulas to quantify the impact. For example: (Projected Carbon Price per Ton) x (Your Scope 1 & 2 Emissions) = Additional Annual Operating Cost.
- Integrating with Internal Data: We pull the necessary data from your ERP, asset management systems, and GHG inventory to feed into these formulas.
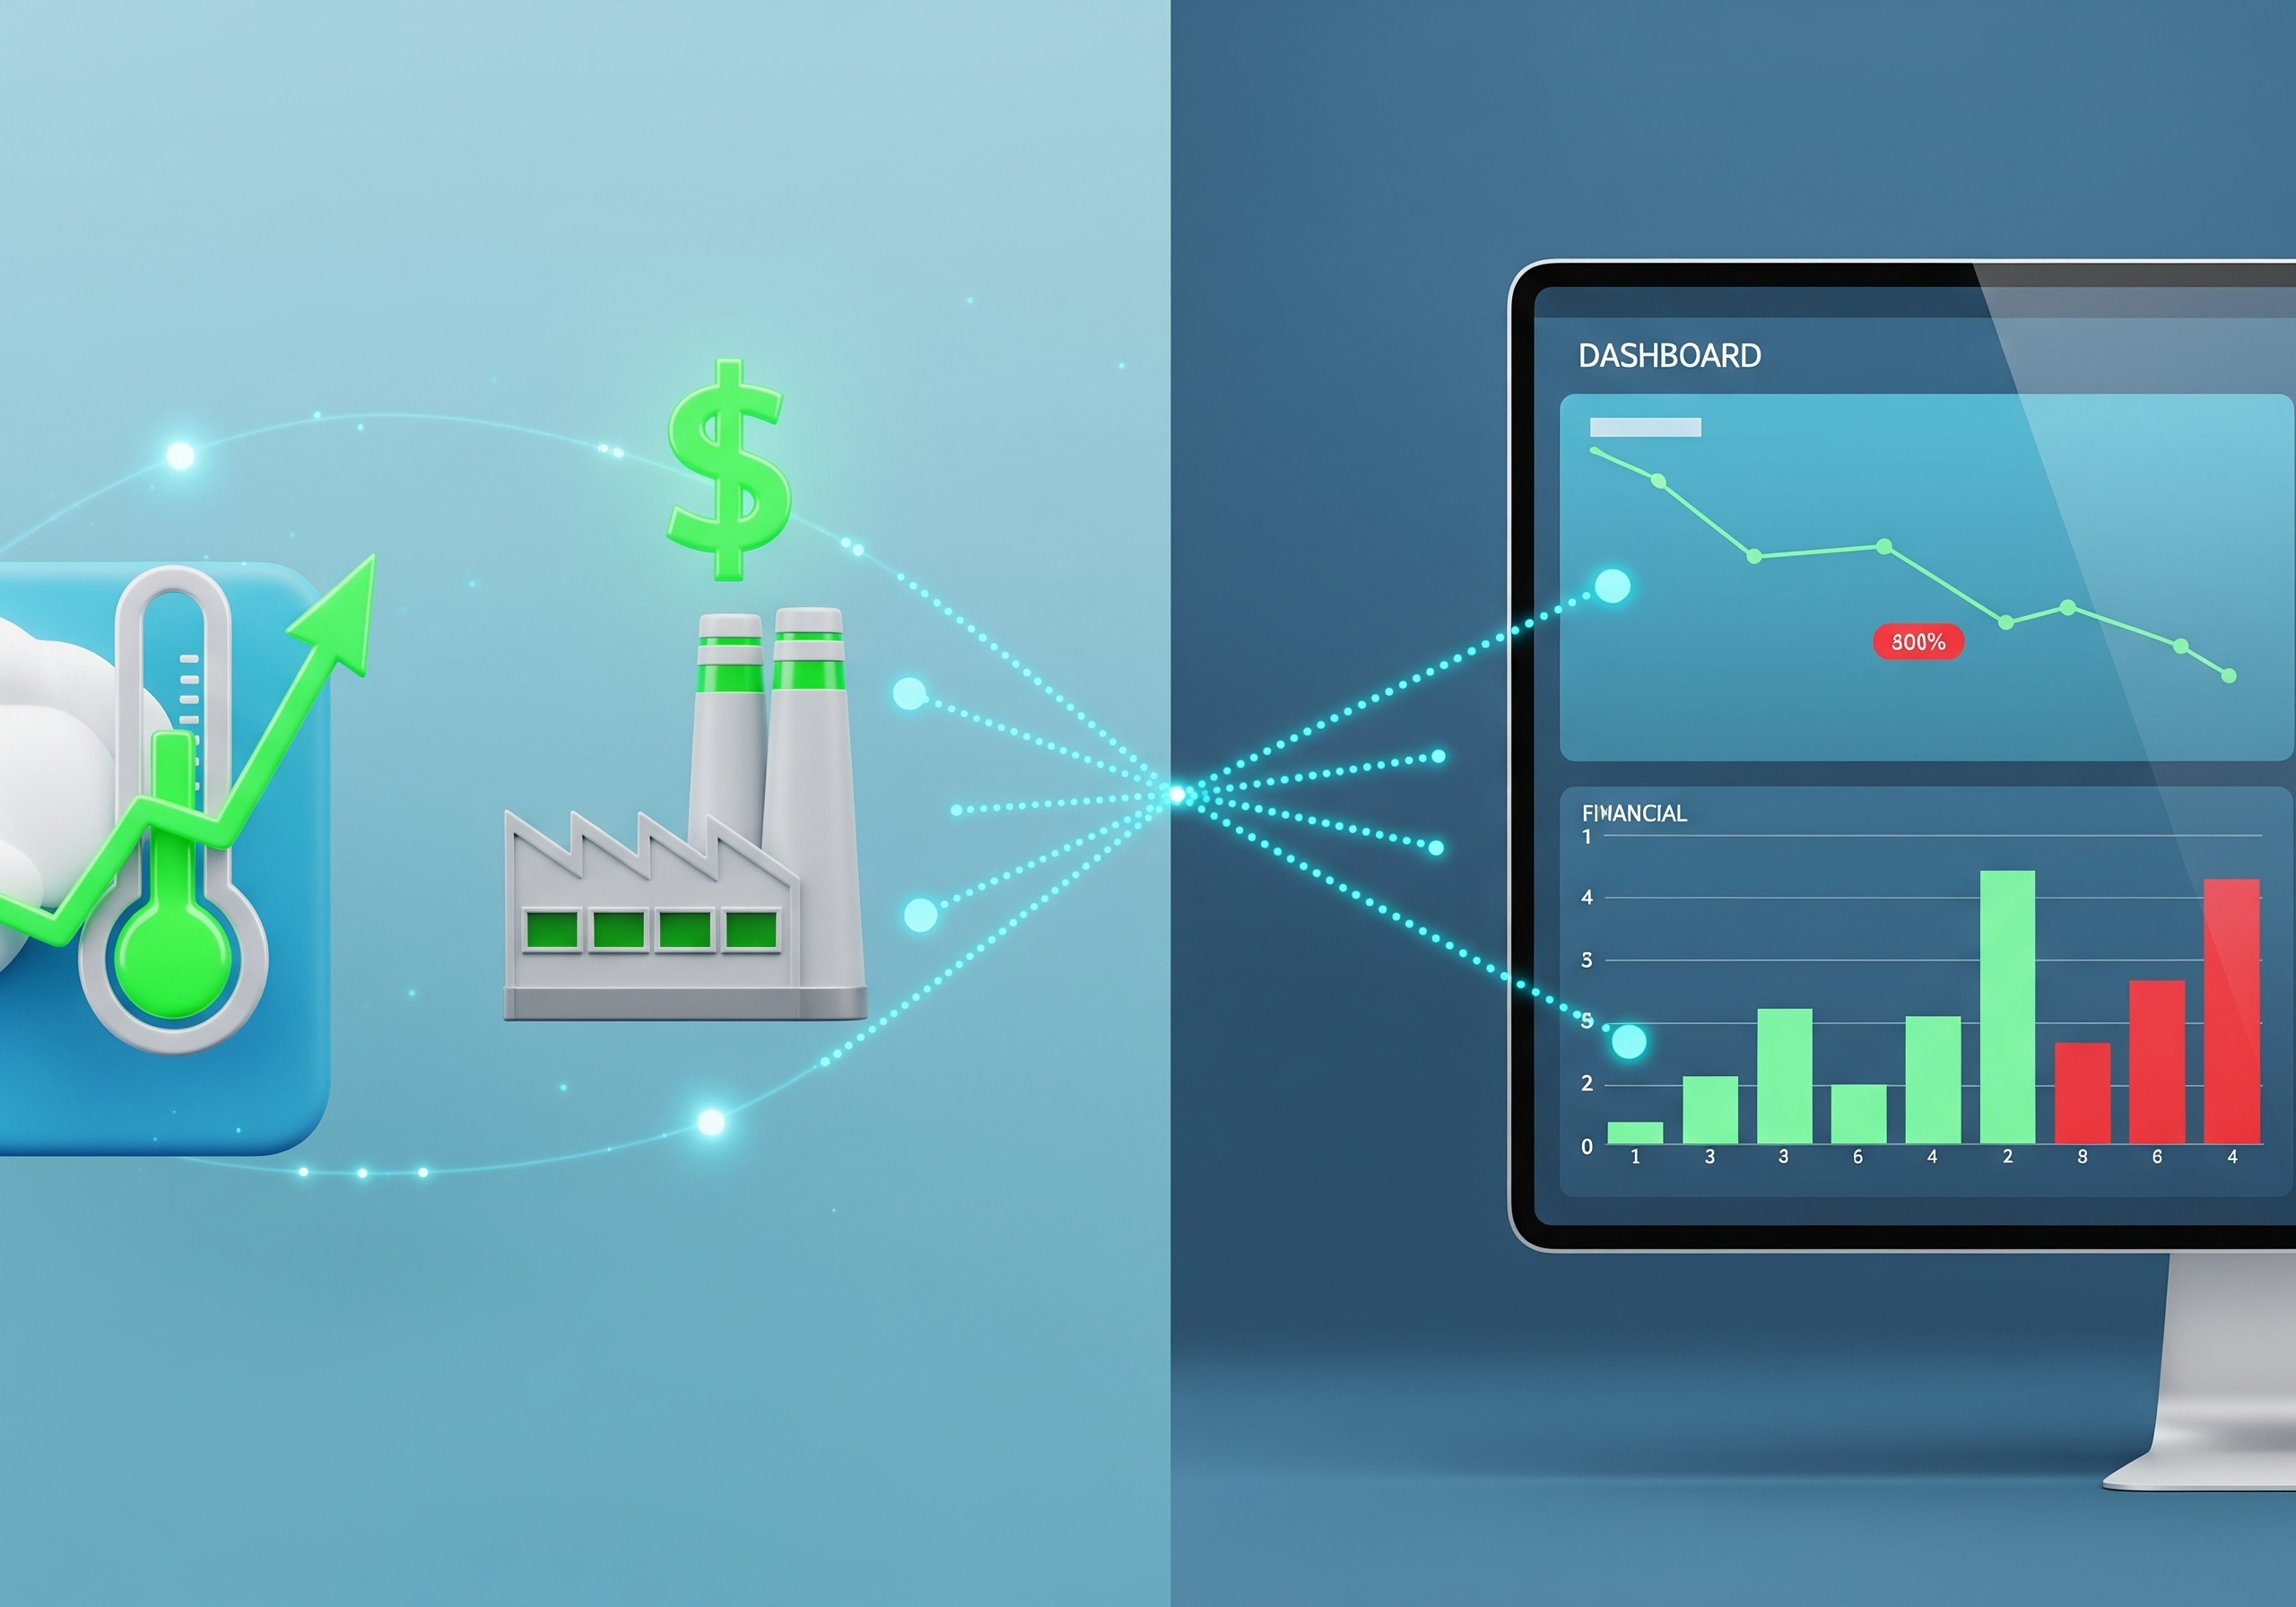
Step 3: Build the Dashboard
A complex model is useless if it's not understandable. The final step is to create an interactive dashboard using a tool like Power BI or Tableau. This allows executives to perform "what-if" analysis, toggling between different climate scenarios (e.g., a 1.5°C vs. a 3°C world) and immediately seeing the potential financial impact on revenue, OPEX, and asset value. It transforms TCFD from a compliance exercise into a powerful strategic planning tool.
Don't just disclose your climate risk. Quantify it.
We provide the technical tools to give your board and investors the clarity they demand.
Let's build your climate risk data model.